 Web Design Inspiration, Templates, and Development Blog
What are Power BI Templates?
Power BI dashboard templates are pre-built layouts designed to help users quickly and easily visualize their data in a meaningful way. These templates contain various visualizations such as charts, graphs, and KPIs that can be customized to suit specific business needs.
Power BI UI framework is a data visualization platform used primarily for business intelligence purposes. Designed to be used by business professionals with varying levels of data knowledge, Power BI’s dashboard is capable of reporting and visualizing data in a wide range of different styles, including graphs, maps, charts, scatter plots, and more.
Bootstrap UI framework is a popular open-source framework that provides a collection of pre-built design components and styles that can be used to create responsive and mobile-first user interfaces. Power BI, on the other hand, is a powerful business intelligence and data visualization platform that allows users to create and share interactive dashboards, reports, and data visualizations.
Power Bi Dashboard is a data visualization and reporting platform that is used by businesses professionals every day. While the platform is commonly used by business analysts, it is also specifically designed to be easily accessible for those without any specialized data knowledge.
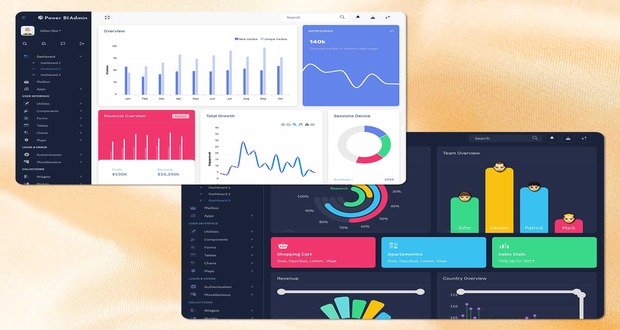
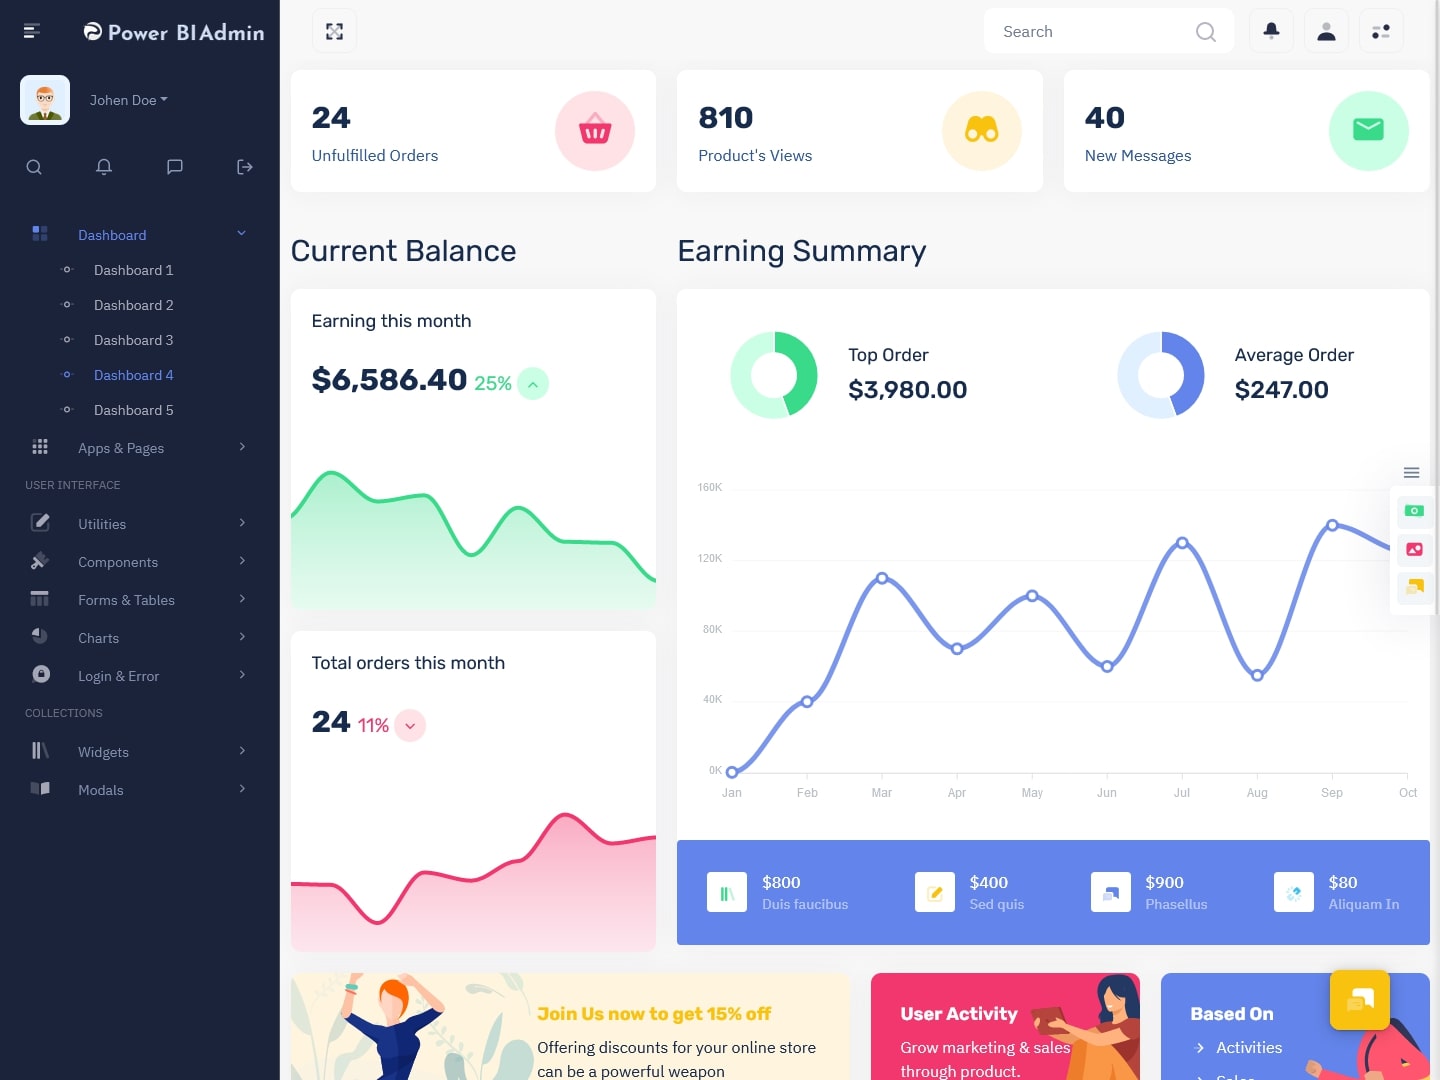
Power Bi Admin – Light Visualization Dashboard
Dashboard – 1
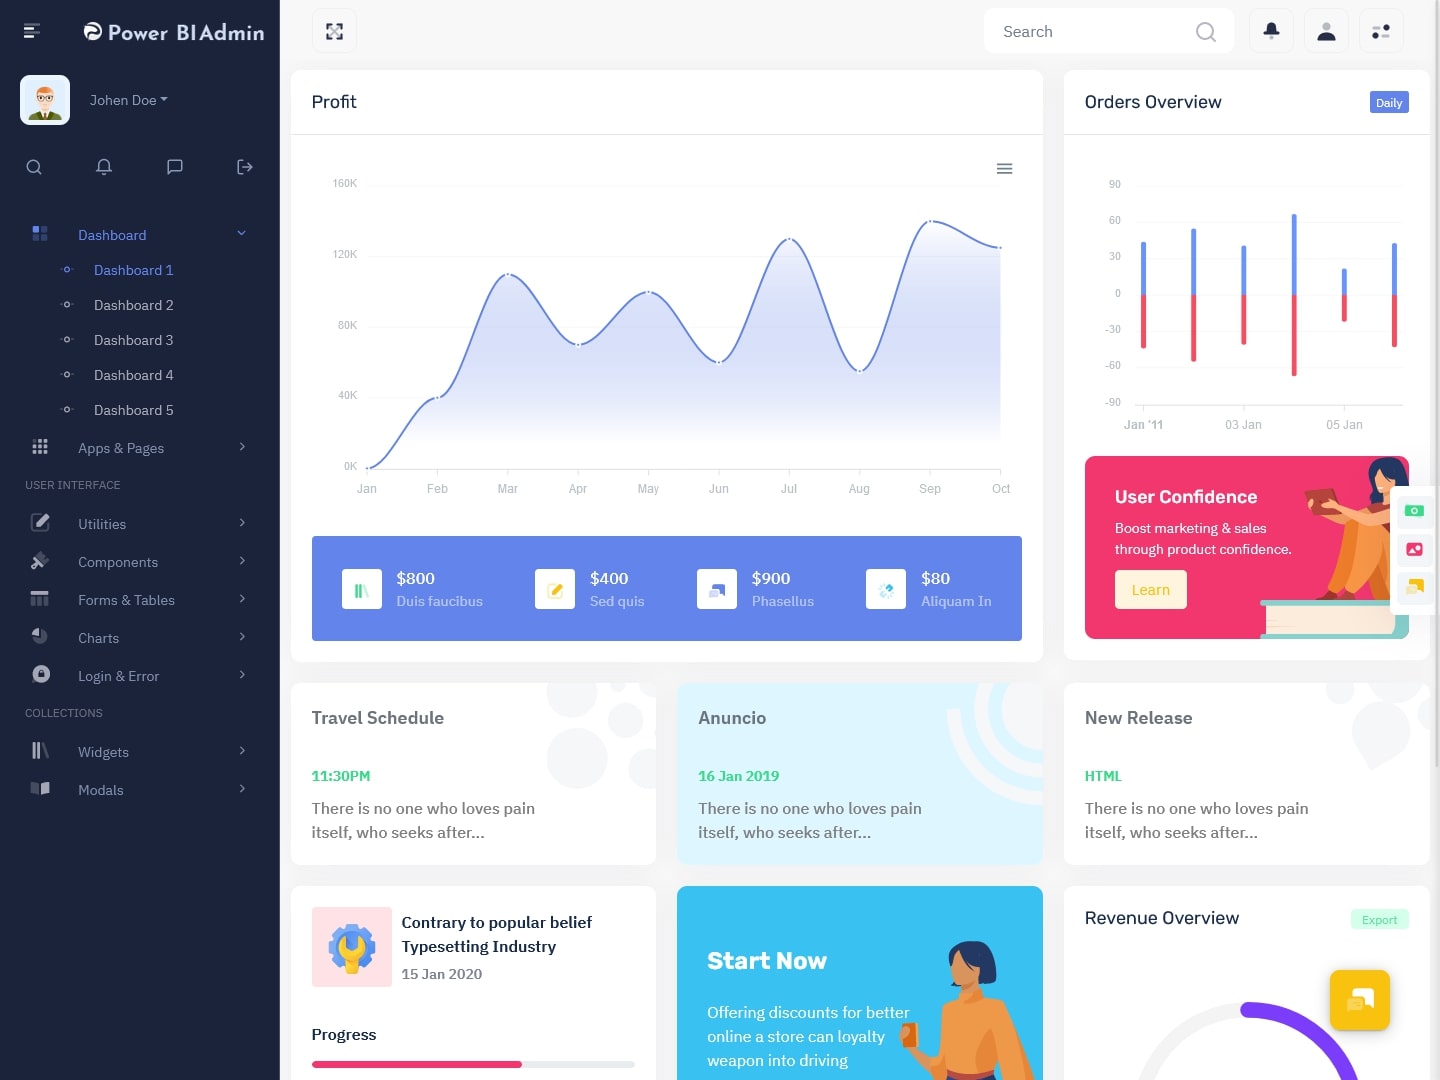
MORE INFO / BUY NOW DEMO
Dashboard – 2
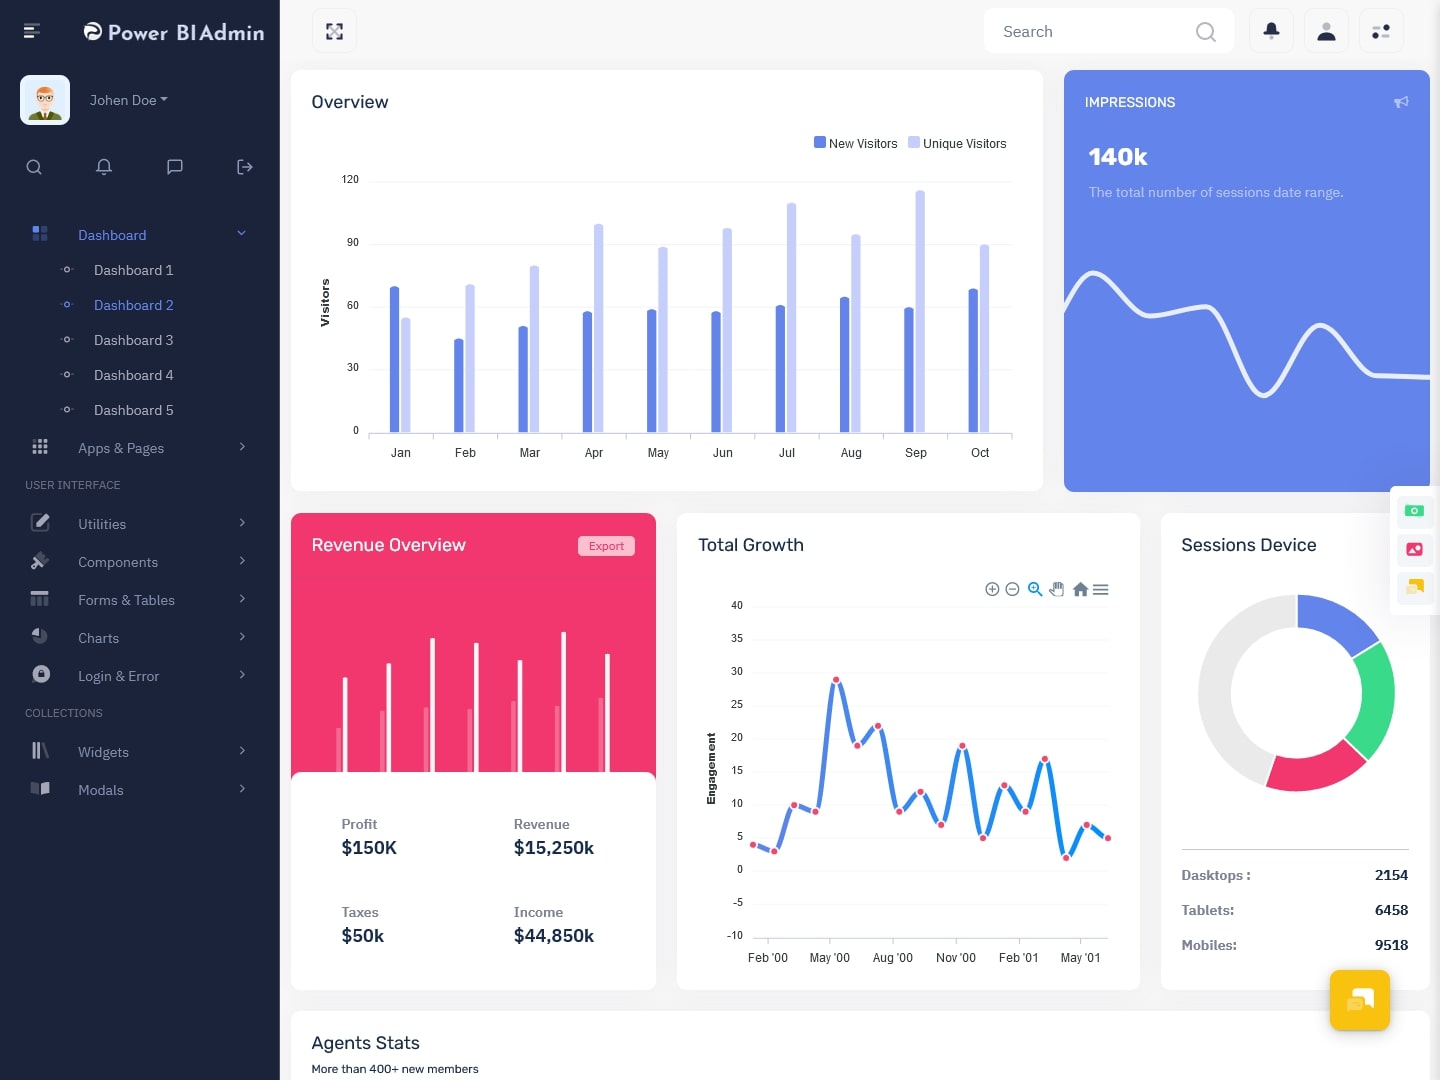
MORE INFO / BUY NOW DEMO
Dashboard – 3
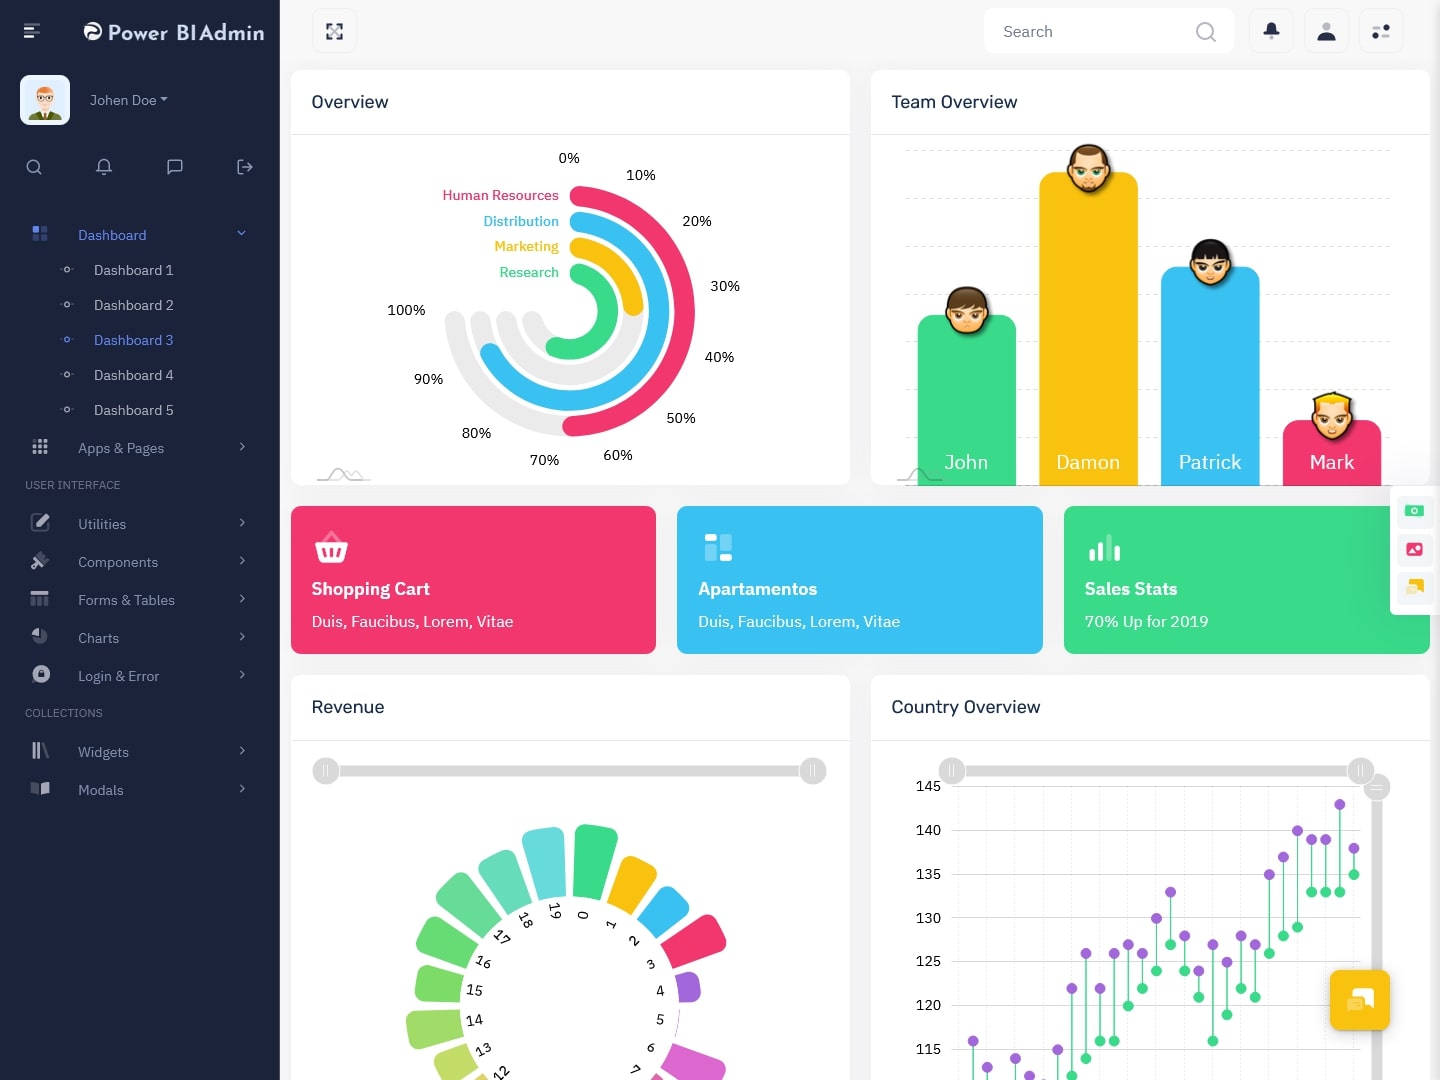
MORE INFO / BUY NOW DEMO
Dashboard – 4
MORE INFO / BUY NOW DEMO
Dashboard – 5
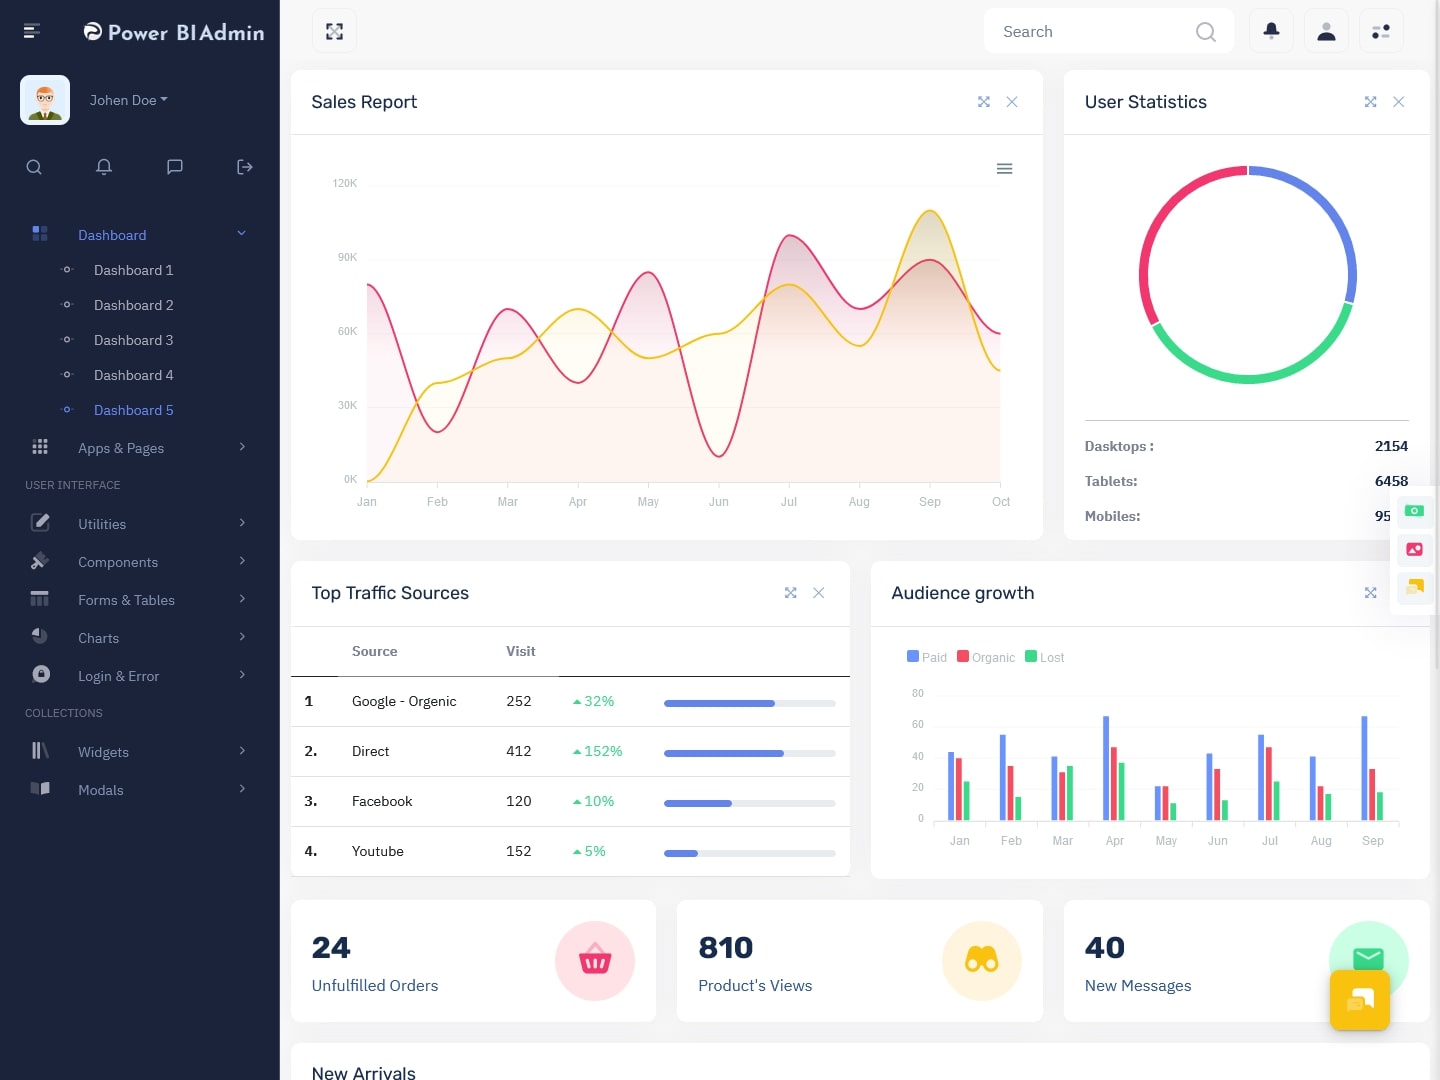
MORE INFO / BUY NOW DEMO
Why Use Power BI Dashboard ?
Power BI dashboard templates offer a streamlined way to create visually appealing dashboards without starting from scratch. By utilizing these templates, users can save time and effort while still achieving professional-looking results. Whether you’re a business owner tracking key metrics or a data analyst presenting insights to stakeholders, Power BI dashboard templates can help you present your data in a compelling manner.
How to Use Power BI Admin Template
Using Power BI dashboard templates is simple. Start by selecting a template that aligns with your data visualization goals. Then, customize the visualizations by connecting them to your data sources and adjusting settings such as colors, fonts, and layout. Once you’re satisfied with the dashboard, you can easily share it with others or export it for further analysis.
Benefits of Power BI Dashboard Templates
One of the main benefits of Power BI dashboard templates is their versatility. Whether you’re looking to track sales performance, monitor inventory levels, or analyze customer feedback, there’s a template available to suit your needs. Additionally, these templates are designed to be user-friendly, making them accessible to users of all skill levels.
Take Your Data Visualization to the Next Level
By harnessing the power of Power BI dashboard templates, you can take your data visualization efforts to the next level. Whether you’re looking to gain insights into your business operations or present data in a compelling way, these templates provide a valuable tool for achieving your goals. Start exploring the world of Power BI dashboard templates today and unlock the full potential of your data.
Overall, the Power Bi UI framework on Bootstrap 5 Dashboard Template provides a powerful set of tools for creating customized and visually appealing user interfaces for Power BI applications. The framework’s responsive design, customizable elements, and consistency make it a valuable tool for developers, designers, and business users looking to create engaging and effective Power BI applications.